Flare™ V6.1 released: New features and science enable rapid exploration and analysis of lead compounds and ligand series, and effective communication of project results
Flare V6.1 introduces new and enhanced scientific features and methods including R-Group Analysis, Hit Expander and the Multi-Layer Perceptron machine learning method for building QSAR models. This release also expands the choice of available tools to troubleshoot Free Energy Perturbation (FEP) experiments, analyze dynamics trajectories, and create ligand custom parameters for dynamics and FEP simulations. Options for recording a movie of your Flare project, or to export a video replaying a dynamics trajectory, further enhance Flare’s capabilities to effectively communicate your scientific results.
Rapidly assess and step through the hit-to-lead process with minimal expenditure on wet-chemistry using Hit Expander
The new Hit Expander workflow enables you to select a molecule and decide a set of allowed modifications which you can choose to apply either to the whole molecule or to a selected substructure. Hit Expander will then automatically generate all the resulting analogues, assessing their charge state and creating a sensible 3D conformation for each of them. The resulting set of variations of the original ligand can then be prioritized by means of short Flare FEP calculations using a minimum spanning tree (Figure 1), using an existing QSAR model, or using Electrostatic Complementarity™.
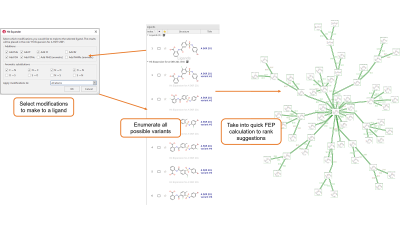
Figure 1. Hit Expander workflow.
Rapidly analyze ligand series with a common core using R-Group Analysis
The new R-group Analysis (RGA) feature in Flare is based on the RDKit decomposition method. RGA can be used to rapidly analyze ligand series with a common core, exploring how changes in the substitution pattern at each R-group position affect biological activity and other key physico-chemical properties.
The core structure to investigate can be easily selected from the 3D window (Figure 2, left). Flare will then identify all the possible R-group positions for that core structure (Figure 2, right).
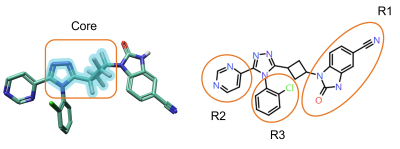
Figure 2. Left: The core structure to use for RGA can be easily selected from the 3D window. Right: R-Groups found by RGA.
The results are shown in the ‘R-Group Analysis Results’ table (Figure 3), a tabular overview of the substituents found for each ligand at each attachment point, together with selected properties for each ligand.
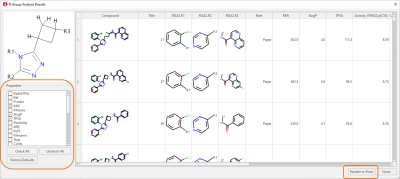
Figure 3. R-Group Analysis Results table. Data taken from taken from Waaler et. al.
RGA results can be easily transferred back to Flare, where informative visual tools can be used to gain insights about the impact on key ligand properties of changing R-groups at single attachment point (RGA Boxplots, Figure 4, left), or at two different R-group positions (RGA Heatmaps, Figure 4, right). Heatmaps are also useful to identify gaps in the chemical exploration, by finding the combinations of most promising substituents which have not been tried yet.
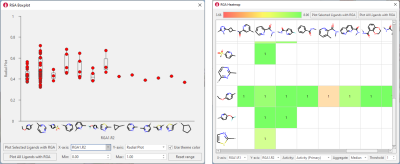
Figure 4: RGA Boxplots (left) and RGA Heatmaps (right) are informative visual tools for investigating the results of RGA and understand the impact on key properties of changing substituents at different group positions.
Enhanced QSAR capabilities enable you to choose the best molecules to make
The new MLP regression and classification models join the existing panel of robust and well validated machine learning methods available in Flare (Figure 5, left). MLP models can be used to build predictive QSAR models for activity and ADMET properties, using Cresset 3D descriptors modeling the electrostatic and shape properties of aligned ligands or custom 2D and 3D descriptors.
Working with custom descriptors is made easier by a re-designed QSAR model building panel connected to the Column & Activity Editor, where groups of properties can be easily selected and set as QSAR descriptors to be used for model building (Figure 5, right).
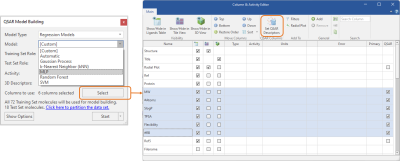
Figure 5. Left: MLP regression and classification models (left) can be built with Cresset 3D descriptors or with 2D and custom 3D descriptors selected from the Ligands table thanks to a streamlined connection to the Columns & Activity Editor (right).
Clustering of Dynamics trajectories
Clustering of trajectories further expands Flare's set of tools for the analysis of Dynamics trajectories.
With a choice different methods and options (Figure 6, right), clustering of trajectories can be run to analyze the results of a Dynamics simulation and group together frames with similar protein conformations. Results are shown in tabular format, with cluster parameters and metrics shown for each cluster. Statistics at the bottom of the table provide useful information to assess the clustering performance.
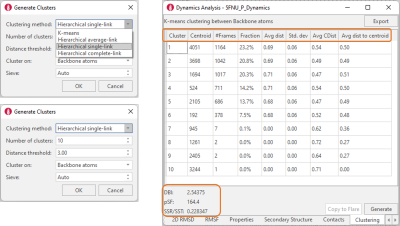
Figure 6. Left: Clustering of Dynamics trajectories can be performed with different methods and a choice of options. Right: Clustering results are reported in a table which shows relevant metrics for each cluster (column headers) and clustering statistics (left-bottom corner).
Centroid frames representative of a cluster can then be easily copied to Flare as additional protein conformations (Figure 7), and used for other studies (for example, ensemble docking and Flare FEP calculations) after minimization.
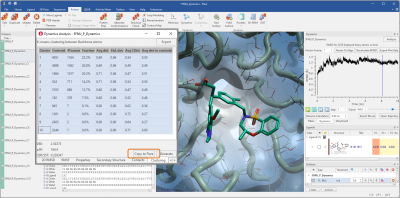
Figure 7. Cluster centroid frames can be copied to Flare and used for ensemble docking and FEP studies after minimization.
Fast FEP analysis using new calculation methods and analysis tools
A new ‘Very Quick’ method (Figure 8, right) is now available as a fast option for Flare FEP calculations, featuring short 1ns, single direction simulations suitable for small transformations (1-2 atoms maximum) such as those generated by Hit Expander. With only a small loss of accuracy with respect to the default 4ns simulations, this method can be used to quickly triage and rank a wide variety of small changes to a central lead molecule, giving excellent guidance not only on what positions are likely to lead to improved activity when substituted, but what types of substitutions are favored.
Together with the Overlap Matrix, the new Link Plot (Figure 8, right) is a tool for investigating problematic link calculations in the Flare FEP network, helping you decide whether certain links should be re-run with adjusted calculation parameters (for example, a higher number of lambda windows).
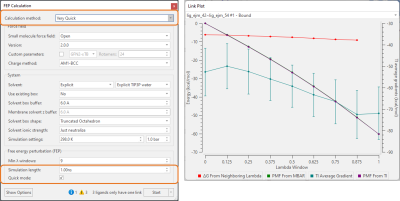
Figure 8. Left: New ‘Very Quick’ FEP calculation method, suitable for ranking small molecule modifications. Right: The new Link Plot can be used in combination with the Overlap Matrix to investigate problematic links in the FEP perturbation network.
Enhanced workflow for creating custom force field parameters
Accurate force field parameters, and in particular torsion parameters, are essential to reliably predict the thermodynamic properties of small molecule ligands and cofactors. Flare V6.1 includes new and enhanced options for creating custom torsion parameters for ligands in support to Dynamics and Flare Free Energy Perturbation studies.
The new GFN2-xTB extended semiempirical tight-binding method is now available to rapidly create optimized custom parameters for charged and neutral molecules. This method is faster and offers wider element coverage with respect to the ANI-2x deep learning QM approximation method implemented in the previous version of Flare. ANI-2x remains in Flare as an option to create slightly more accurate parameters for neutral molecules, in an improved workflow giving enhanced results with respect to Flare V6, at the cost of longer calculation times.
Effectively communicate your drug discovery project results by making movies
Use the ‘Record’ button in the View tab to save a movie of the Flare 3D window, of the Flare project, or a full screen. Flexible configuration options (Figure 9 - left) can be used to choose the number of frames per second and the window resolution for the recording.
The ‘Export Movie’ button in the Dynamics window (Figure 9 - right) can be used to export a movie of the Dynamics simulation, setting the number of frames per second, the window resolution for the recording, and the speed for replaying the simulation in the video.
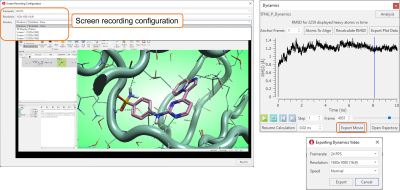
Figure 9. Movies can be exported from Flare, with flexible options to control the quality of the videos being exported.
Enhanced control when running local and remote calculations using Cresset Engine Broker™
If you have access to a cluster of remote resources through the Cresset Engine Broker, pressing the ‘Start’ button drop-down menu will give you more control on where the calculations will be running (Figure 10).
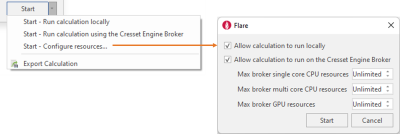
Figure 10. Configure local and remote resources for each Flare calculation.
From this menu, you can choose whether to run the calculation using only local resources or accessing remote resources through the Cresset Engine Broker. Contact us if you don’t have access to this.
Choosing ‘Configure resources’ enables you to set what happens when you press the 'Start' button: by default, both local and remote calculations are allowed, and Flare will choose the best calculation resources available).
The enhanced Start menu in Flare V6.1 also gives access to the ‘Export calculation’ option. Available for docking, conf hunt and alignment, Molecular Dynamics and Flare FEP calculations, this option exports a Flare Python script for running the chosen experiment from the command line using the pyflare binary.
Other enhancements and improvements
Enhancements and improvements in Flare V6.1 also include:
- Calculation and display of Quantum Mechanics electron density maps for ligands
- Enhanced display of QM molecular electrostatic potential maps
- Automatic enumeration of ligands with undefined stereocenters in support to docking and scoring experiments
- New function to superpose two ligands based on their maximum common substructure or 3-5 picked atoms
- New Radial Plot window, showing the radial plot(s) for multiple compounds in a separate window
- New function to show boxplots of selected properties
- Enhanced labels for atoms in the 3D window, giving the option to change the background color and style, and move annotations to the desired position in the 3D window
- Enhanced options for creating protein molecular surfaces, increasing the transparency of back-facing surfaces and enabling multiple surface clips
- And many more, which you can explore in the Flare Release Notes
Flexible software licensing for computational chemists, medicinal chemists and academics
Flare features flexible licensing options to suit computational chemist, medicinal chemist, and academics. Try Flare V6.1 on your projects – request an evaluation.

