Identify the most active chemical structures with key desired properties through R-group decomposition and analysis

Drug discovery research often involves making small modifications to a compound and studying the subsequent effect on activity. Once a closely related series of compounds has been made and tested, it is very important to analyze which of the substituents enhances activity, and to also know which substitution positions significantly affect the activity, in order to develop the next synthetic strategy. R-group decomposition and analysis in Flare™ is a method that allows you to classify substituents by their position in a given core structure and helps you to identify active substituents at each position.
If the molecules in the dataset have activity data, you can look at the distribution of activity values for each substituent at each substitution position. If you look at two substitution positions at the same time, you can obtain a matrix of substituents, which provides more useful information for identifying the substitution pattern found in the most-active structures in the series, as well as gaps in the chemical exploration strategy.
In this example, we show how R-group Analysis is performed in Flare using a set of CDK9 inhibitors collected from ChEMBL. To simplify the data, the IC50, EC50, AC50, Ki, and Kd (nM) activity values reported by ChEMBL have been treated as one median activity value for each molecule. We excluded molecules of MW > 500 or SlogP > 5 that would interfere with the analysis and prepared a data set of 780 compounds in total.
Defining the Scaffold for R-group Decomposition
The most active compound in this dataset has a 4-amino-pyrimidine skeleton (CHEMBL3694408), with pActivity=11.3. This represents a good starting point to perform an R-group decomposition analysis on.
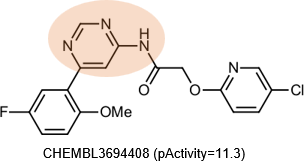
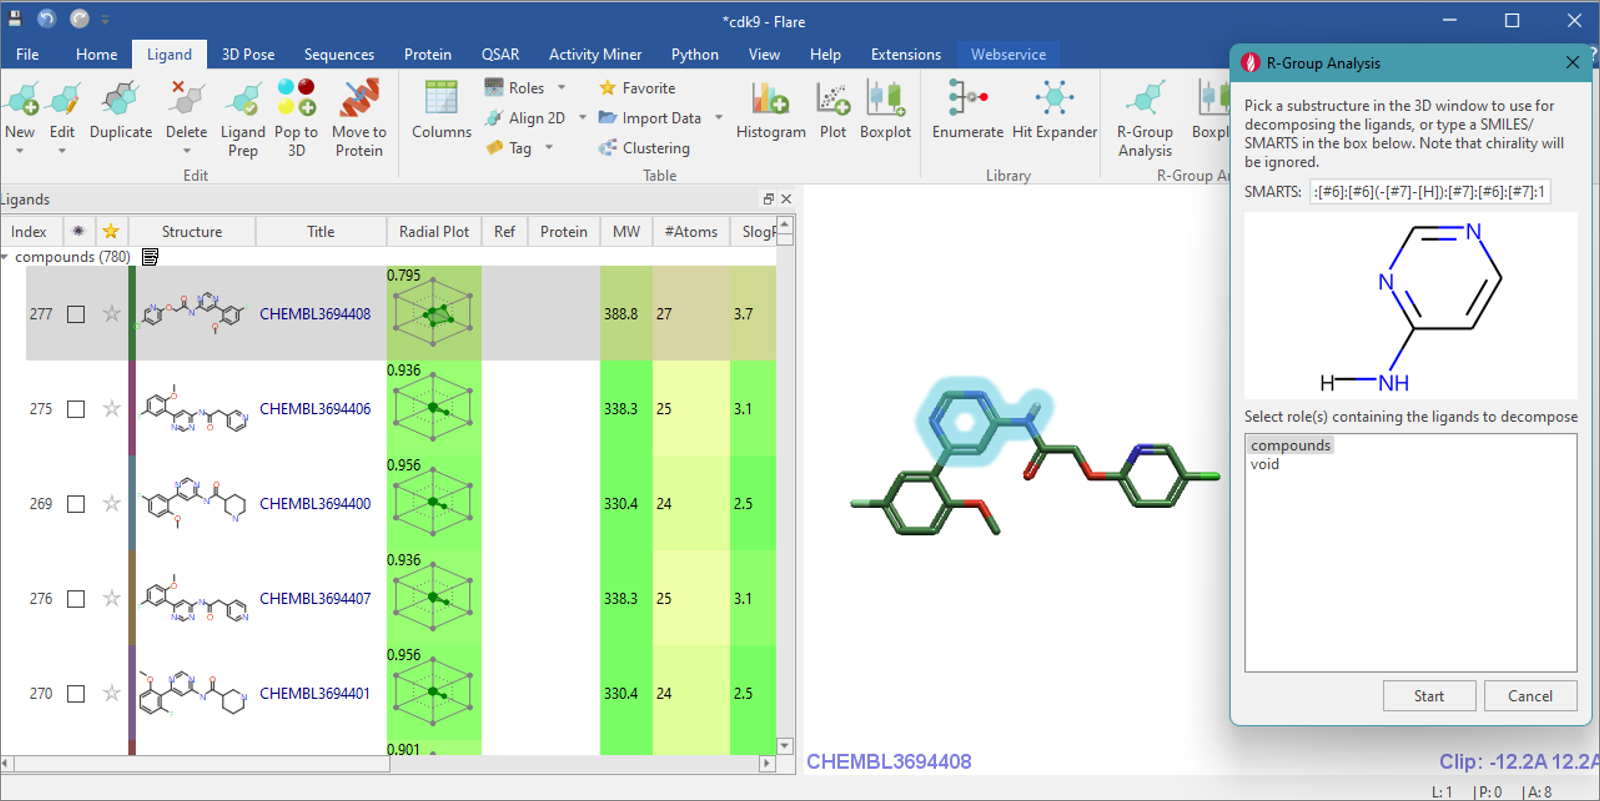
Figure 1. R-group Analysis dialog and selection of atoms in 3D window.
Click on the 'R-group Analysis' icon from the 'Ligand' tab, which will open the R-group Analysis panel. In the 3D window, select the aminopyrimidine moiety and confirm the picked atoms are depicted in the panel before clicking 'Start'. Only molecules matching this substructure in the specified ligand roles will be included in the subsequent R-group decomposition analysis.
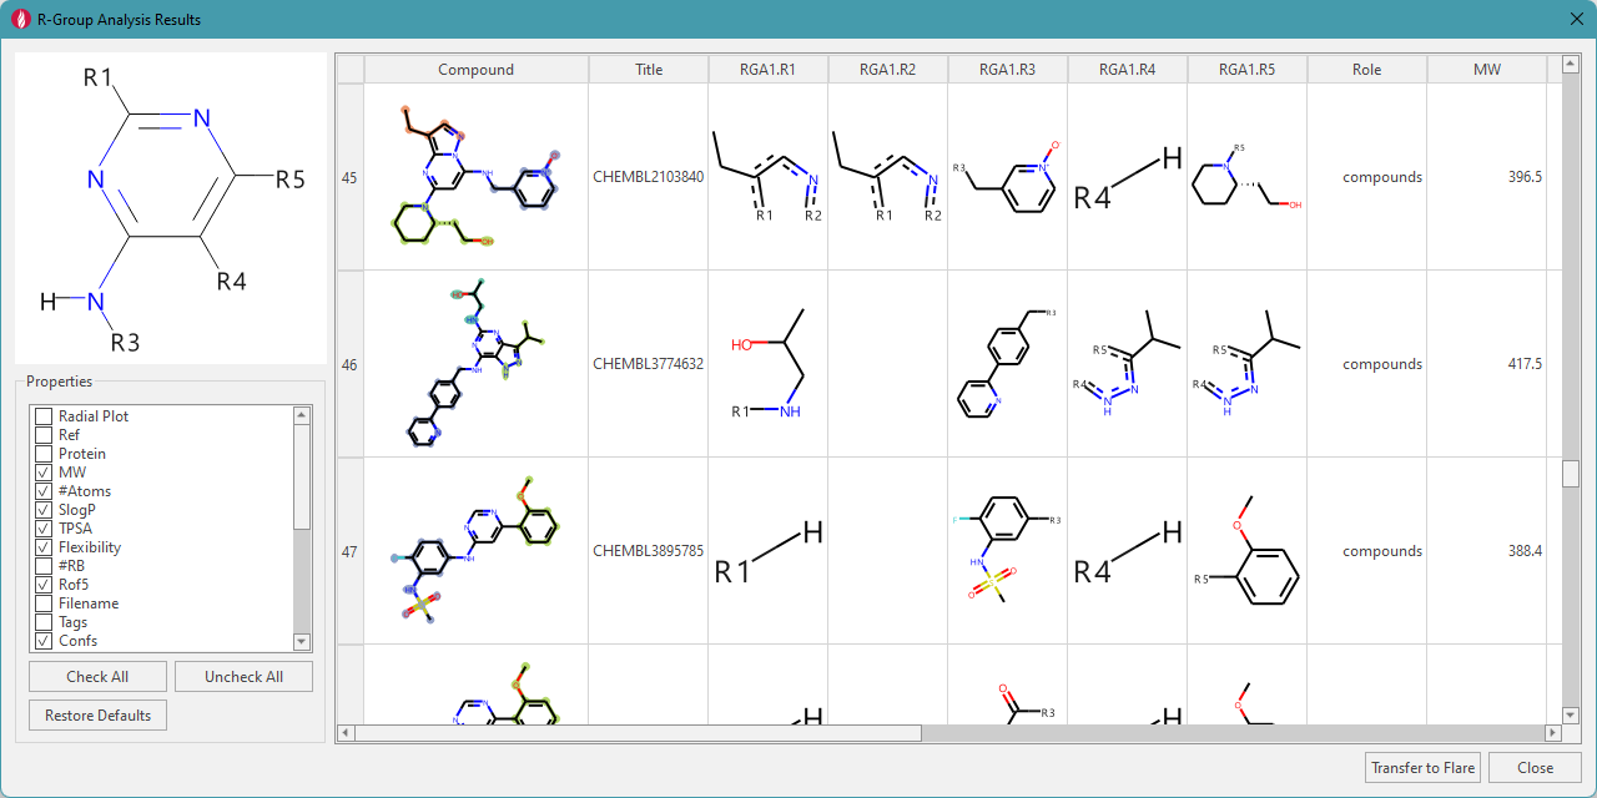
Figure 2. Decomposition dialog: analyzed substitution positions (left top), property filter (left bottom), and a table of molecules showing the core with a different color used for each R-group.
72 compounds with a matching substructure were found in this dataset. The analysis also indicated that the attached R-groups in this ‘mini-series’ of molecules can be found at any of the 4 identified locations: R1, R4, and R5 on the pyrimidine ring, and R3 on the exocyclic amino group (Figure 2, top left). R2, which is missing in this pattern, is used internally as a placeholder for bicyclic substitution, and is shown in the table view. Other columns in the table view include the 'Compound' image, where each decomposed substituent is colored for specific position, while the checked molecule properties are shown in subsequent columns. The results of this decomposition can be transferred to the main 'Ligands Table' by clicking on 'Transfer to Flare' button. Columns in the 'Ligands Table' starting with ‘RGA1.’ are the results of this first R-group decomposition analysis (Figure 3). Subsequent R-group decompositions will have columns beginning with ‘RGA2.’, ‘RGA3.’ etc.
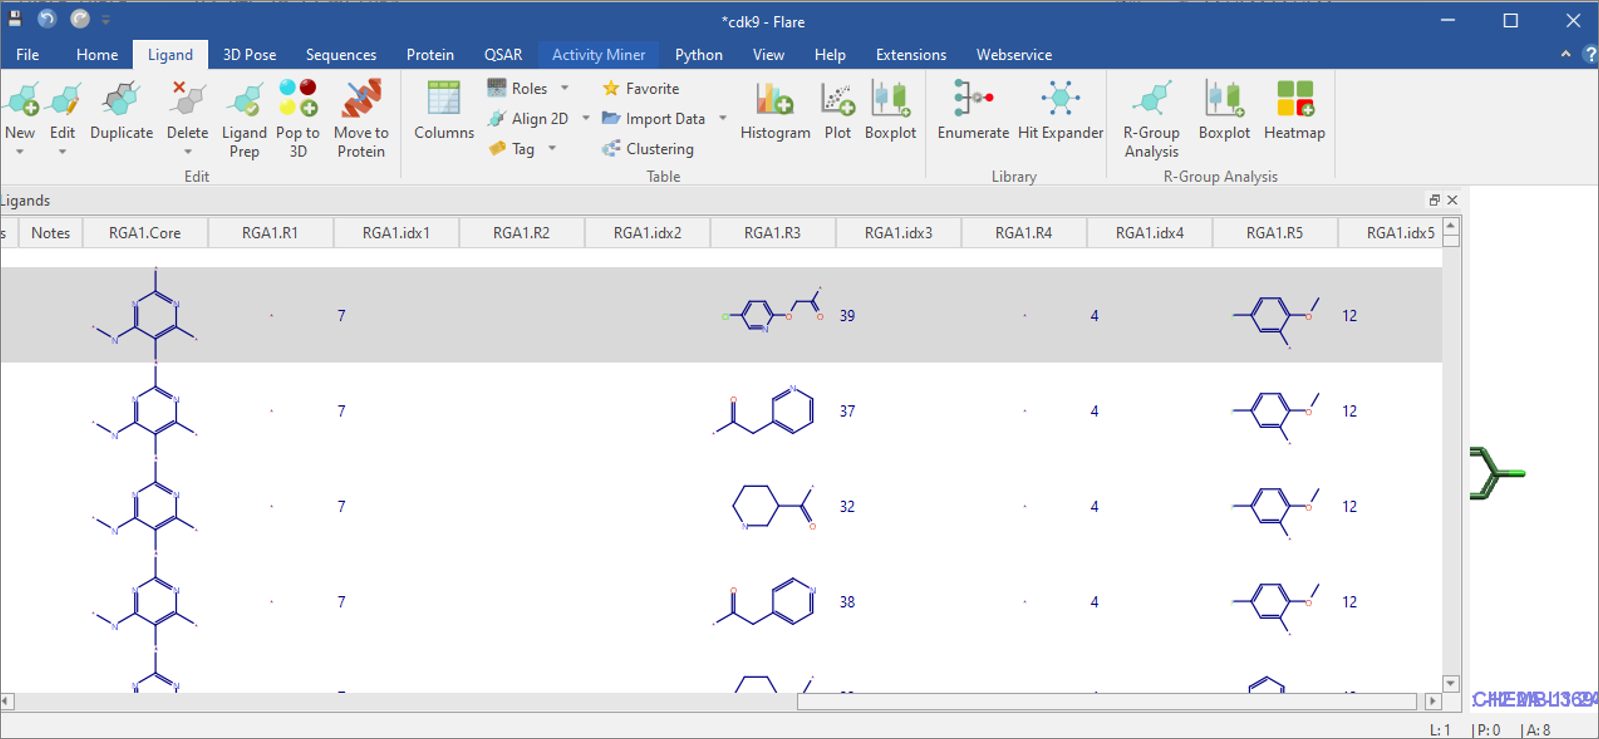
Figure 3. The Flare 'Ligands Table' has R-group decomposition results in columns.
Analyzing the R-group Decomposition Results using Boxplots
R-group Analysis boxplots enable you to examine the activity distribution of the various R-groups at a single substitution position. Figure 4 shows a boxplot of R5, with the second column from the left showing that compounds with an unsubstituted Hydrogen have an activity range of 5.7-8.8 (where the 25th percentile quartile, median, and 75th percentile quartile are shown within the box). When hovering over each of the individual points, an image showing the 2D structure of the molecule with its activity will pop up.
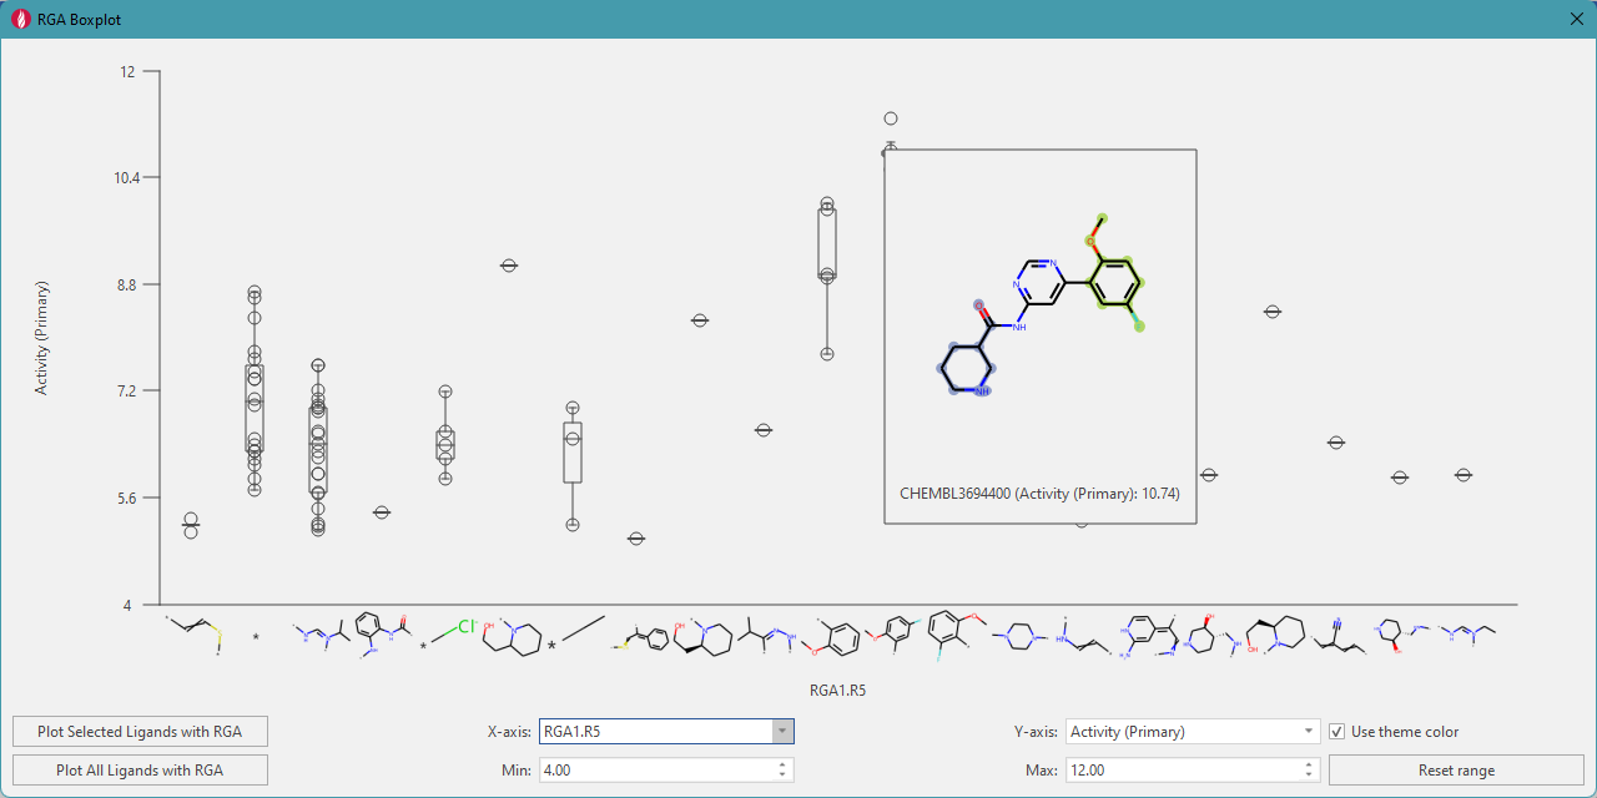
Figure 4. Boxplot for substitution position R5 with activity ranges.
The boxplot shows that the fluoromethoxyphenyl group substitution at R5 significantly contributes to the activity. As well as selecting individual points, you can also specify a rectangular region in the boxplot to select multiple ligands (Figure 5).
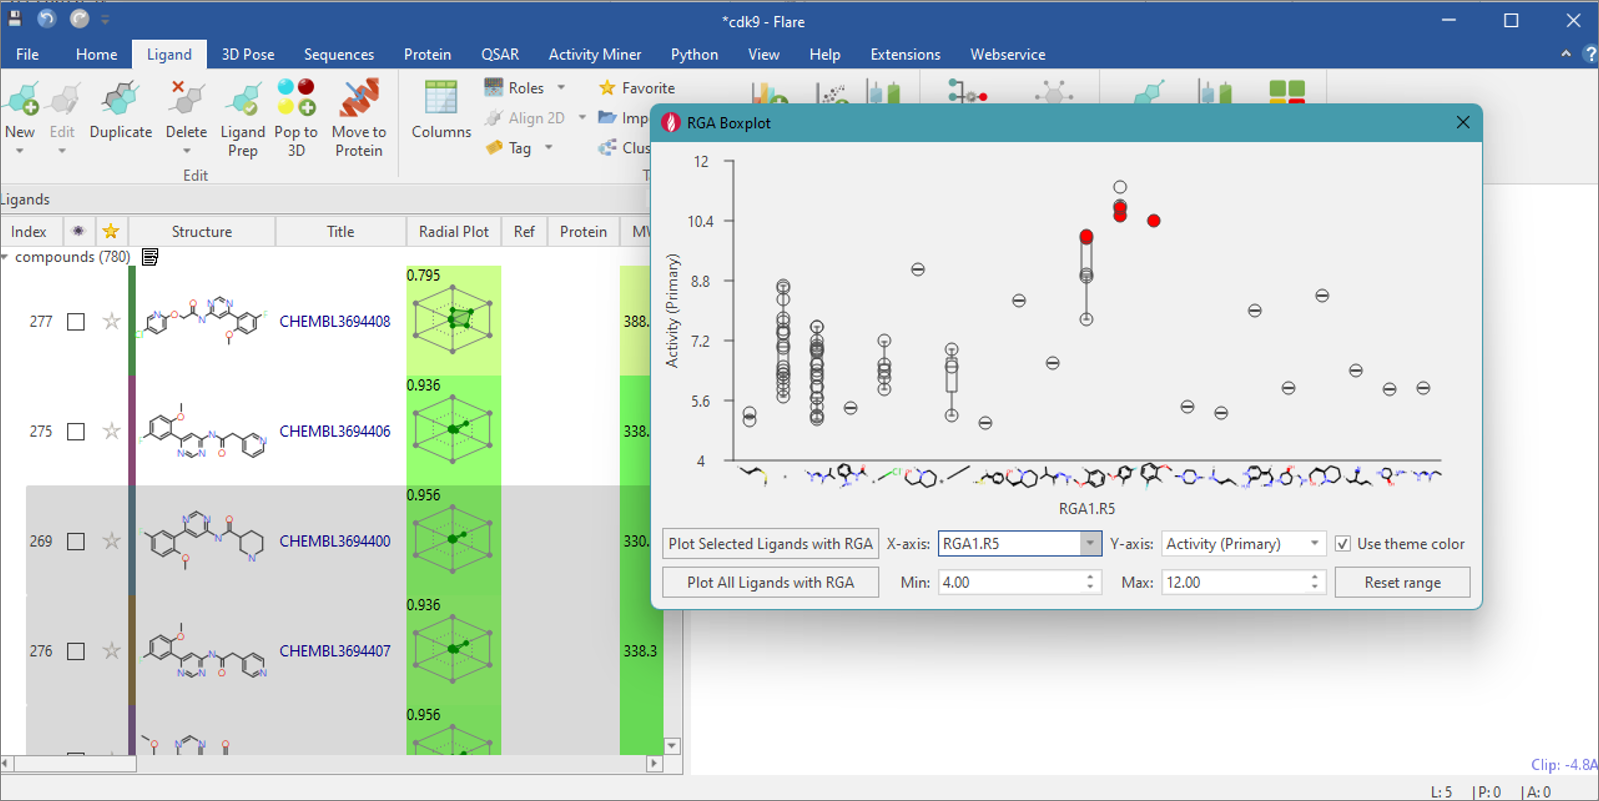
Figure 5. Rectangular region highlights molecules in the main 'Ligands Table'.
Analyzing the R-group Decomposition Results Using Heatmaps
Another way to review the data is by using a heatmap which is color-coded by activity. Figure 6 shows an example of a two-dimensional matrix with R5 (horizontal) and R4 (vertical). The color of the cell (which corresponds to the color bar at the top of the RGA Heatmap window) indicates whether the presence of both substituents has a positive or negative effect on the activity. For example, the strong-green cell where the mouse pointer is located has four compounds with a high median activity value. This cell identifies the group of compounds with high activity shown in the pop-up window; clicking on the cell selects these compounds in the 'Ligand Table' (in Flare's main window). The compound shown in the lower right corner is the compound with the highest activity value in the original dataset, and you can easily identify that there are three other compounds with the same core structure and substitution pattern that also have high activity.
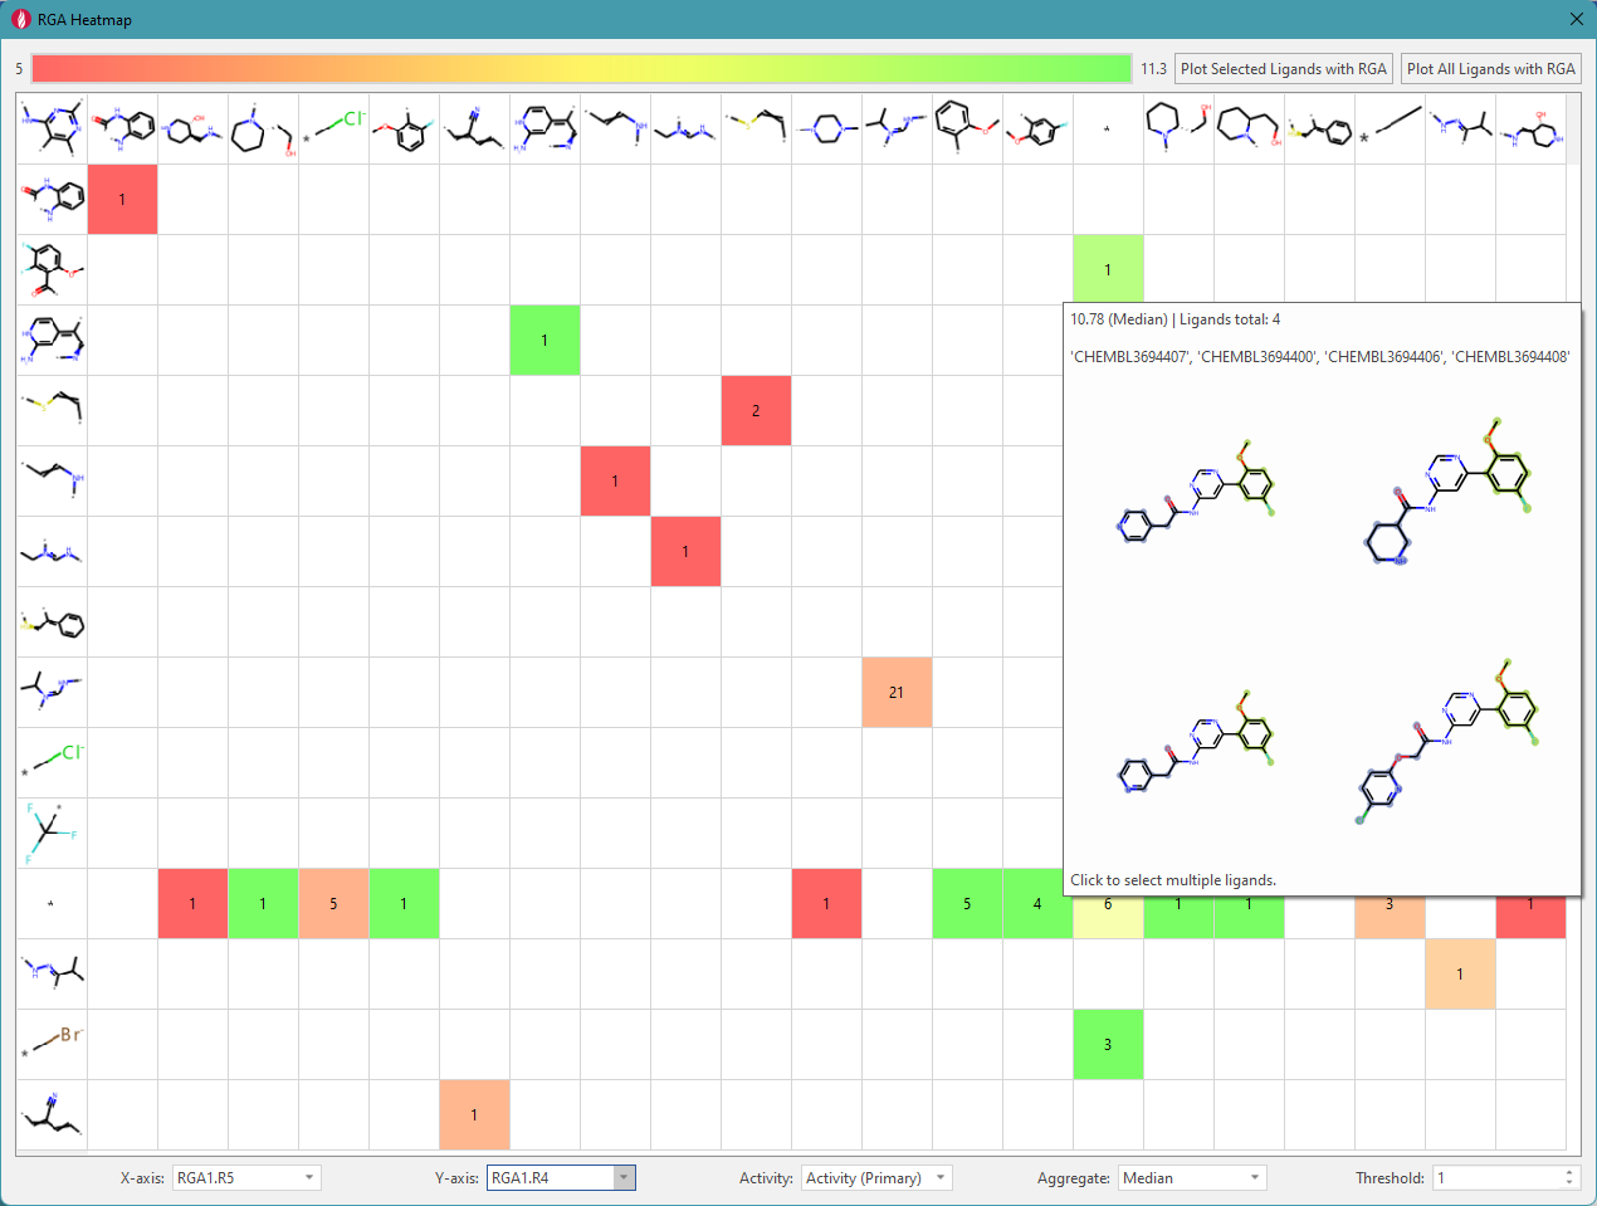
Figure 6. Heat map (matrix) for two specified substitution positions.
Clicking on a substituent structure on the top row of the matrix will sort the column by its frequency and the aggregated activity. Figure 7 shows the first part of a matrix after clicking on three of the R5 substituents to collect the structures containing them towards the top of the matrix. This gives you an idea of how sparse the matrix is with any of the substituents present in the most-active compounds, and helps you subsequently identify further possible changes to existing compounds which don’t contain these favorable groups. The check marks in Figure 7 highlight specific groups that could be added to existing molecules to potentially improve their activity.
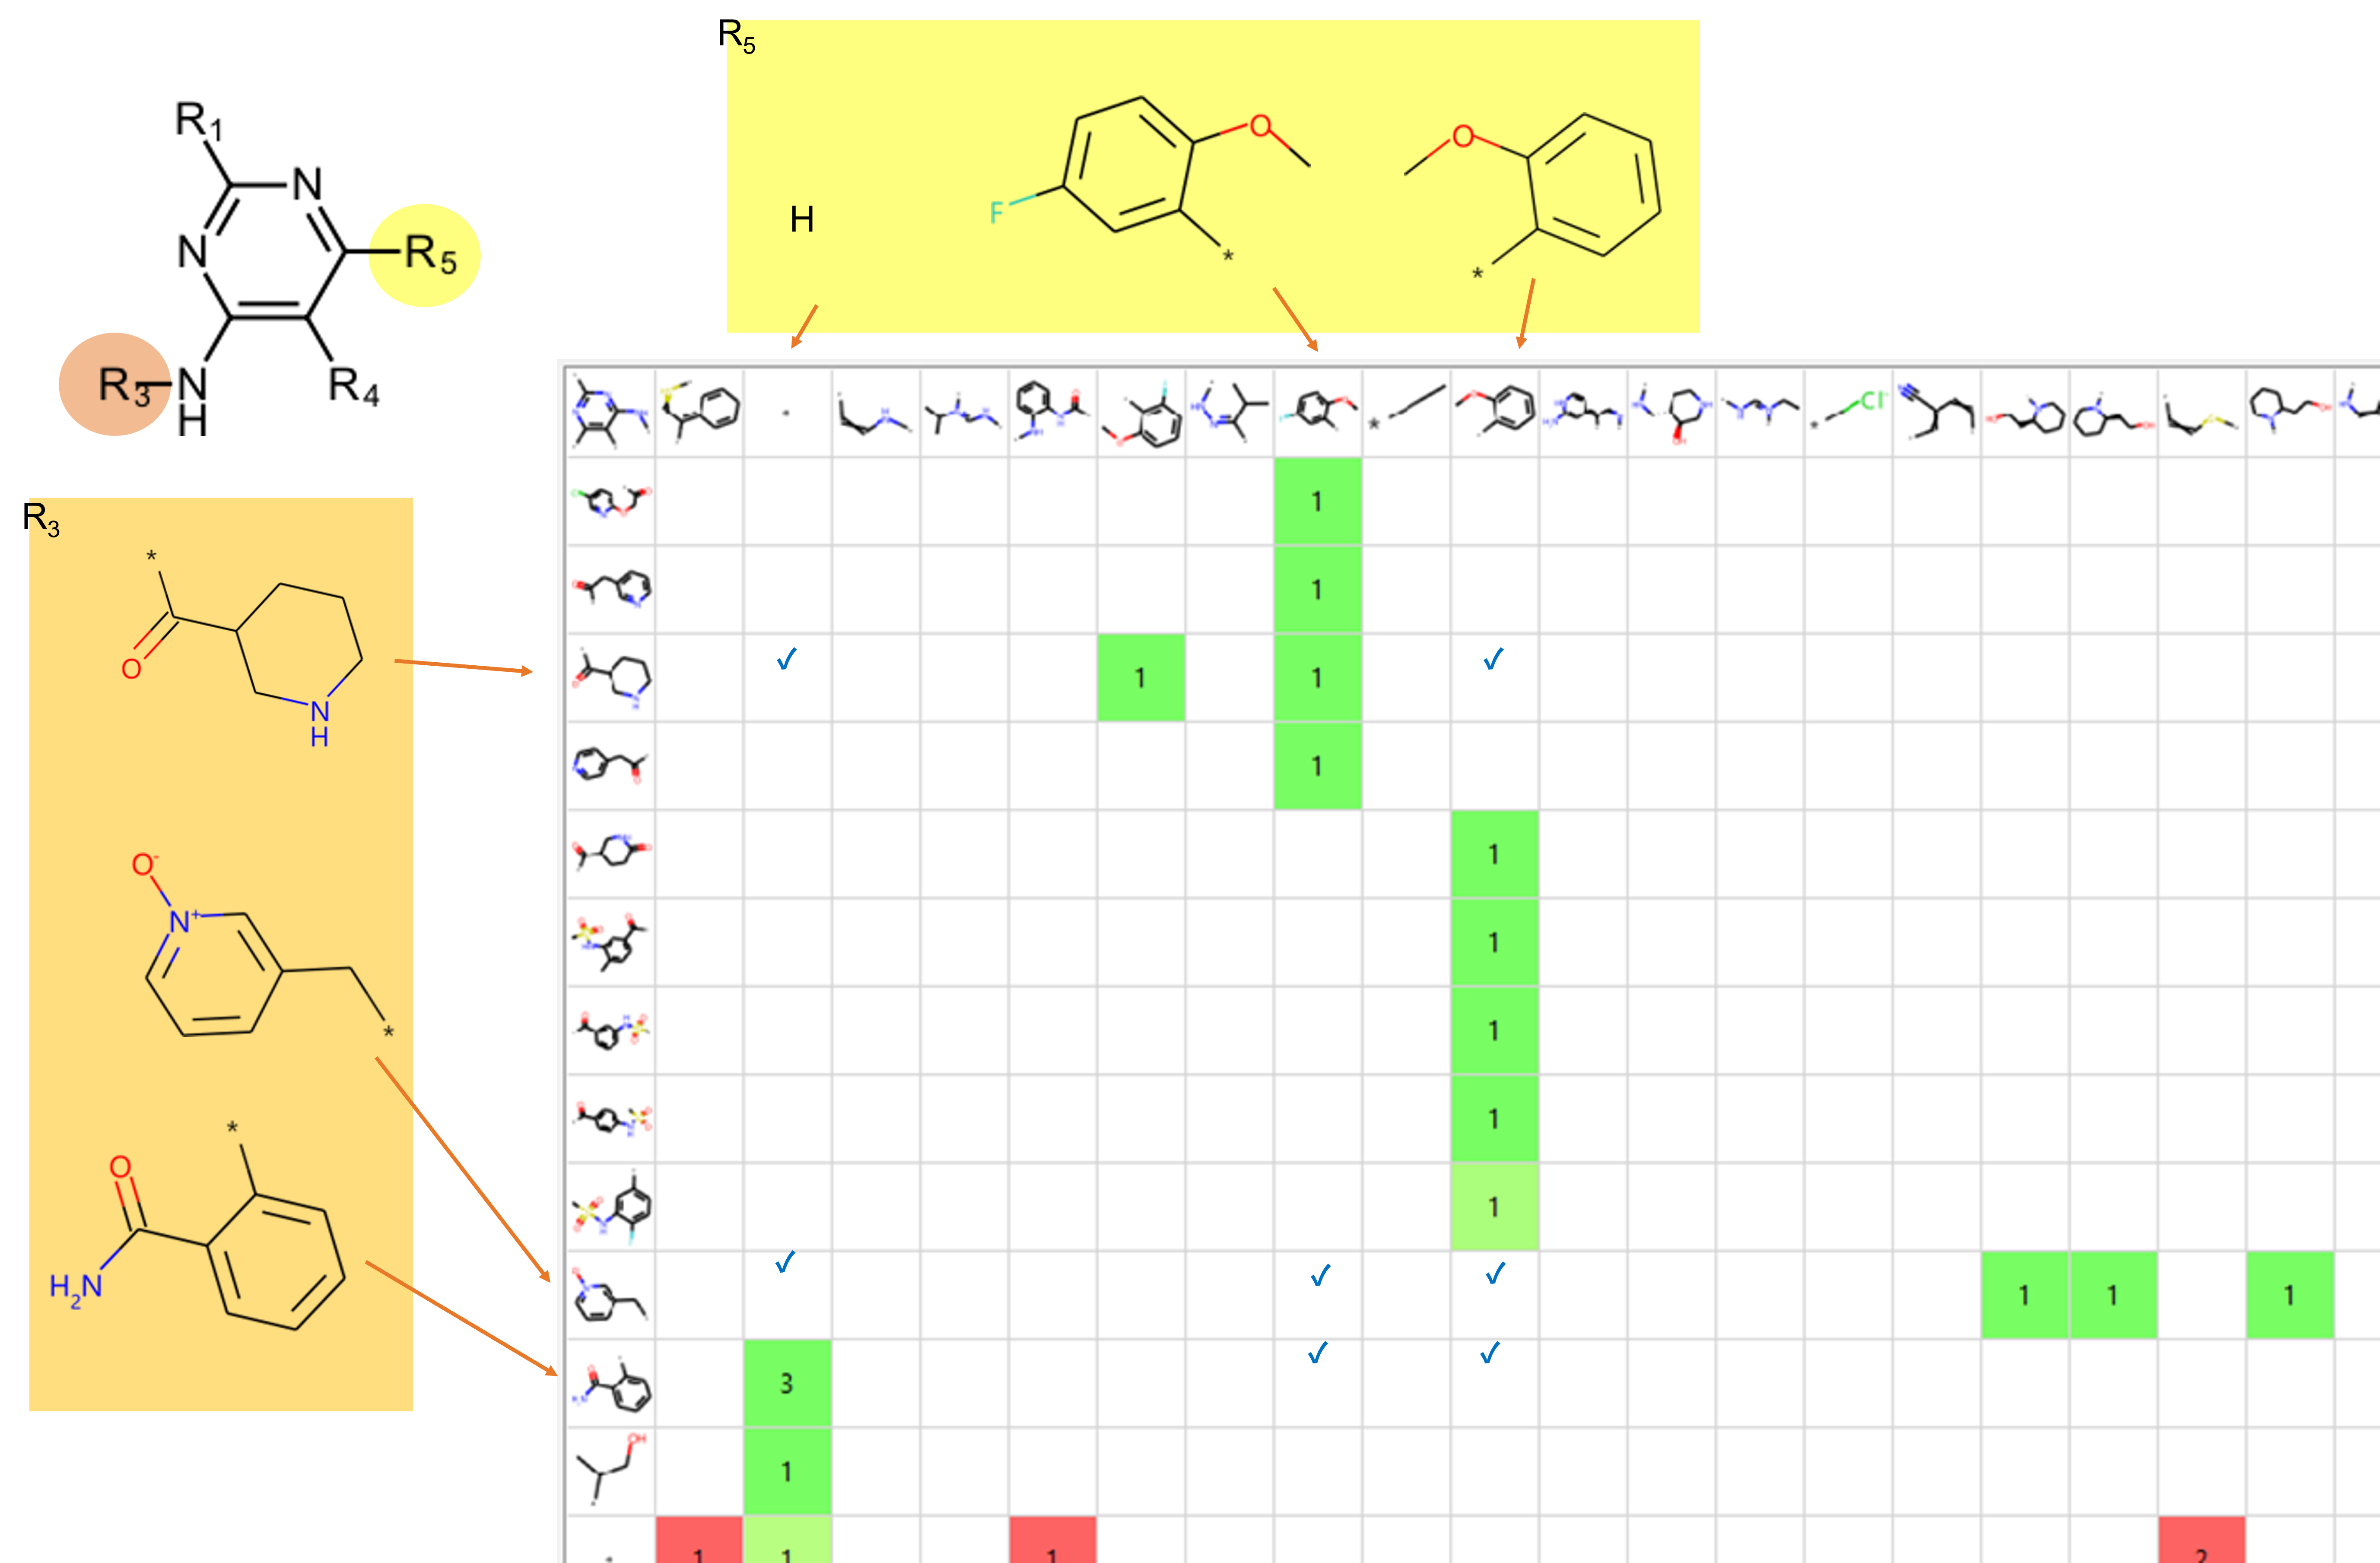
Figure 7. Part of sorted matrix for finding missing compounds.
Conclusion
R-group Analysis enables you to examine the distribution of active compounds by substituent position, and to understand the structural features required for high activity, which is useful for designing active molecules that may have been missed in the initial medicinal chemistry design and synthesis stage. In the Flare GUI, users can easily perform R-group analysis using only a few mouse clicks.
Begin to analyze your molecule series with the R-group decomposition functionality, by requesting a free evaluation of Flare today!