Spark databases: To update or not to update?
Reagent availability can vary depending on suppliers thus we update the twenty-two reagent databases derived from eMolecules building blocks on a monthly basis. I was curious to see how the number of reagents changes over time, so took a look at the databases we have released over the last 18 months.
Spark™, your solution for scaffold hopping and R-group exploration, is provided with reagent and fragment databases that are derived from commercially available and literature compounds.
Reagent availability can vary depending on suppliers thus we update the twenty-two reagent databases derived from eMolecules building blocks on a monthly basis. I was curious to see how the number of reagents changes over time, so took a look at the databases we have released over the last 18 months (March 2018 until September 2019).
Variations in database sizes: Visual analysis
Figure 1 displays the month on month variation of the number of reagents in each database. Overall, the database sizes vary significantly from several thousand molecules (e.g., eMolecules_isocyanateCO) up to tens of thousands of molecules (e.g., eMolecules_acid).
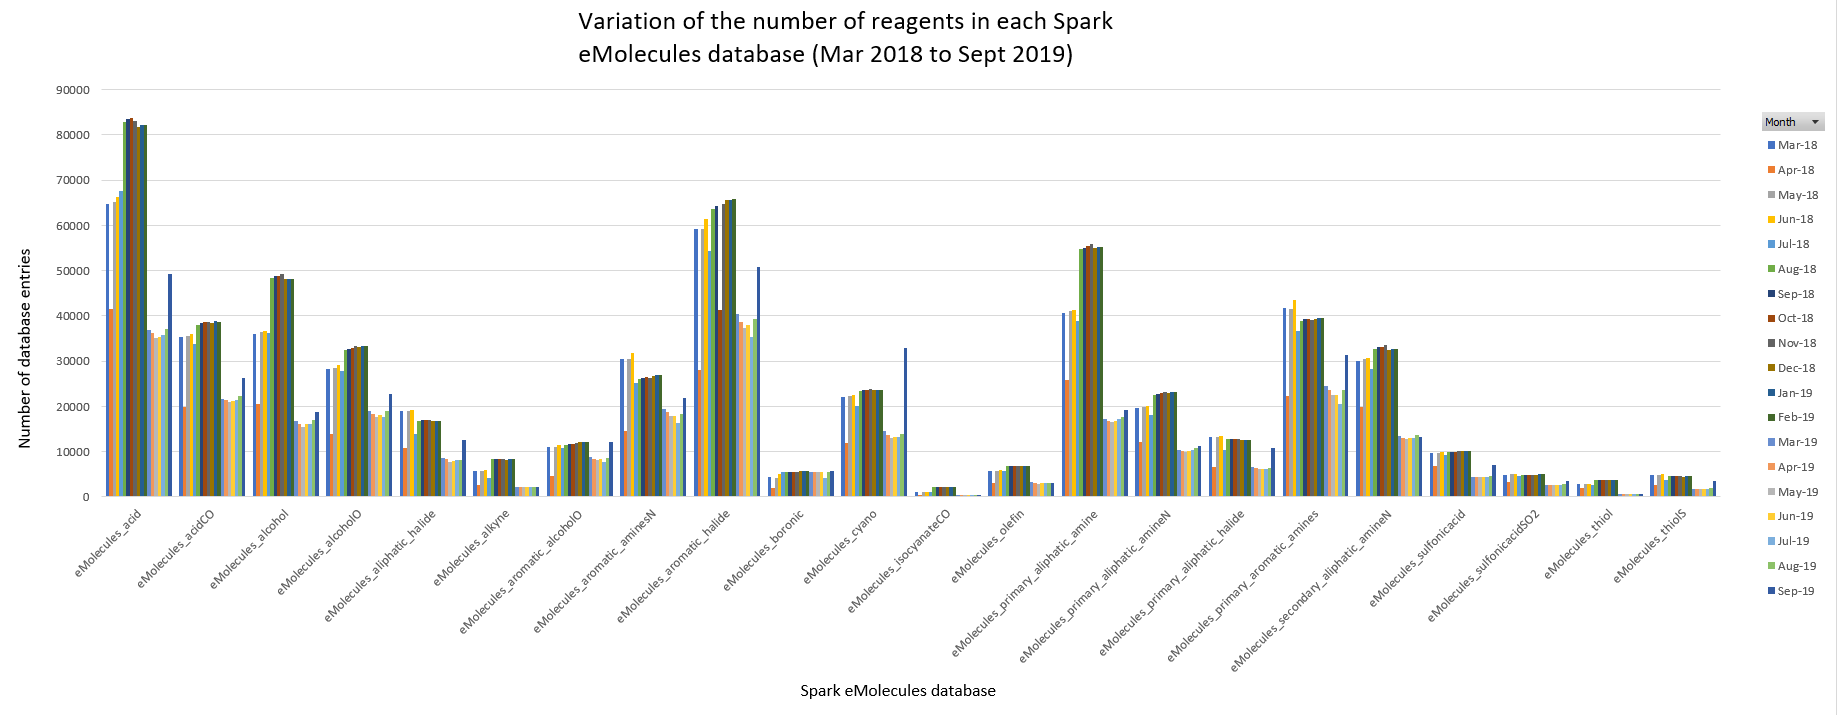
Figure 1: Monthly variation of the number of reagents contained in each Spark eMolecules database.
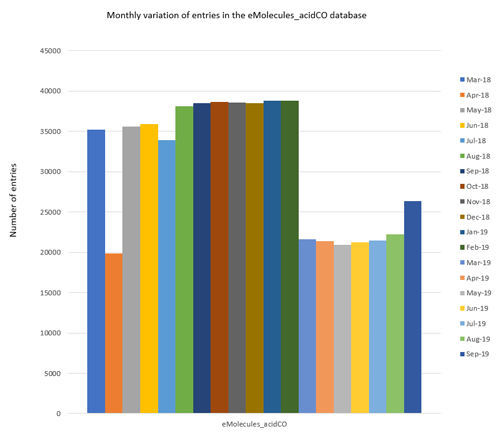
To illustrate the two apparent trends more clearly I have selected a representative database (eMolecules_acidCO) and plotted separately in Figure 2.
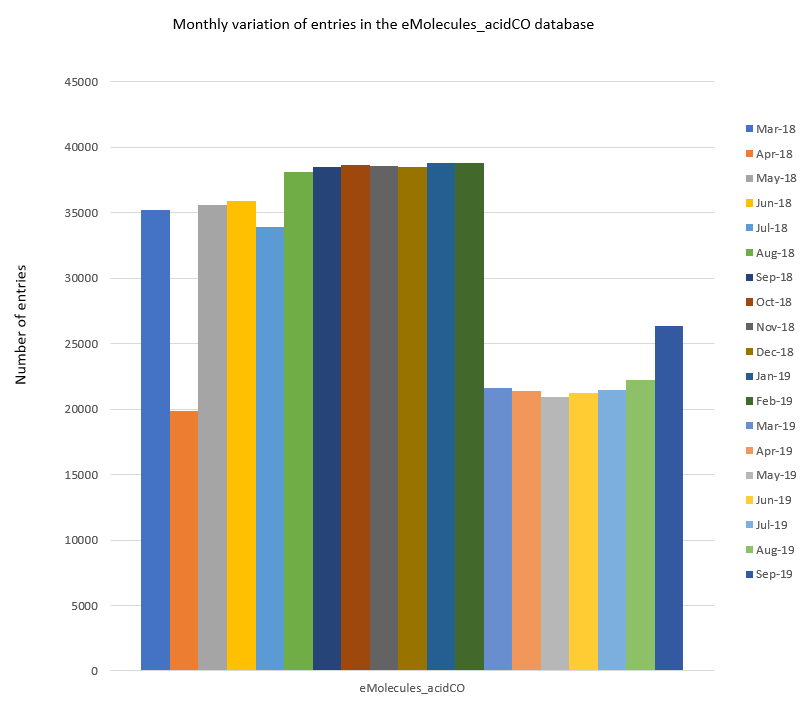
Figure 2: Monthly variation in the number of entries in the eMolecules_acidCO database.
Firstly, in April 2018, the eMolecules_acidCO database (and all other databases) features a significant drop in the number of entries. When generating the databases for Spark at that time, we observed that this corresponded to eMolecules moving a number of ‘Tier 3’ category reagents into the ‘Tier 4’ category (i.e., the shipping timeframe for these reagents changed from ‘ships within 4 weeks’ to ‘synthesis required; up to 12 weeks’). This change is temporary, and the data set sizes can be seen to revert to their previous levels in May 2018, however, delivery times for any reagent orders made within April 2018 could have been affected by the category change.
The second trend is similar to the first and was observed in March 2019. Again, a steep drop in the number of database entries can be seen for 21 of the 22 eMolecules databases (the only database seemingly not affected is the eMolecules_boronic dataset). On this occasion, however, the comparatively low number of reagents is roughly maintained for all the affected databases until September 2019 when the number of entries can be seen to rise again (albeit only slightly in most cases) for 15 data sets.
As a side note, you may recall that we made the decision to remove Tier 4 compounds from our Spark databases in December 2017. This change of category for a significant number of database entries not only affects reagent delivery times, but also which reagents are available for you to search in Spark databases. If you would like to be able to include Tier 4 compounds in your Spark experiments, please contact our user support team who will be able to help.
Variations in database sizes: Numerical analysis
In Figure 3 I have plotted the standard deviation for each database, calculated as a fraction of its average size over the 18 month analysis period, which expresses the databases’ variance. If the number of reagents in a database were not seen to vary, we would expect to see a value of zero, where the number of database entries changes a lot we would expect to see a value tending towards one. Looking at the data for all the eMolecules databases, the highest variability can be seen in eMolecules_isocyanateCO with a value of 0.66. This is a small database containing on average 2256 entries over the eighteen-month analysis period thus the variability value of 0.66 equates to ±1488 reagents. The lowest variance in database size can be seen in the eMolecules_boronic database with a value of 0.18. This is another small database containing on average 5116 entries and its fluctuations of ±18% equate to ±920 reagents. If we look at the largest databases, for example eMolecules_acid which contains on average 60527 reagents, its variance is 0.34 which in real terms corresponds to ± 20578 reagents over the analysis period. The bottom line is that even a comparatively small variance (e.g., as seen in eMolecules_boronic) has a significant effect on the number of reagents available for Spark searches and will inevitably affect the search results.
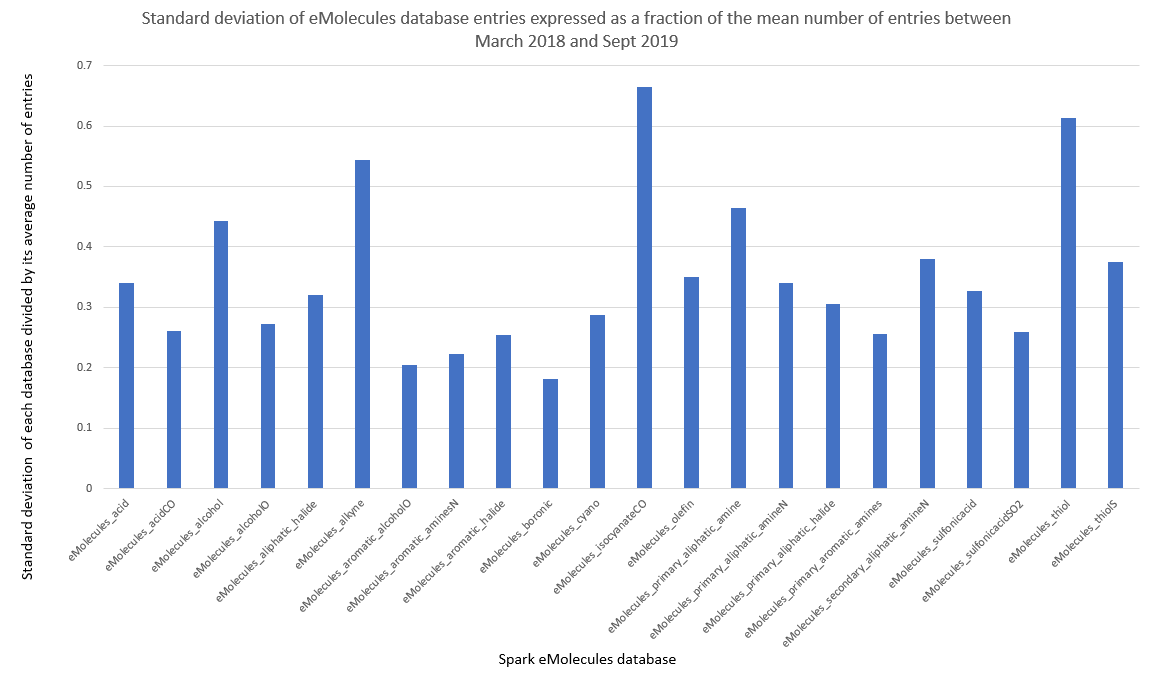
Figure 3: Standard deviation of each database, expressed as a fraction of the mean database size.
Conclusion
As the size of the eMolecules databases may vary significantly and unpredictably from month to month, we strongly recommend that you check for database updates and install all available updates before you start a Spark search. Saving time by not updating databases now may cost you time and money later if you are not using the most up to date availability information and reagent diversity in your Spark experiments.
Spark databases can be updated via the GUI, or via the command line using the command sparkdbupdate. View the Updating Spark databases web clip, or read more about installing Spark reagent databases.
Don’t forget that if you have proprietary chemistry or in-stock reagents you would like to include in a Spark search, you can create your own databases either via the Spark interface or via the command line.


